使用的是前后端分离的开发方式,vue 在 webpack 通过代理进行请求转接,之前在使用 node 开发的时候进行断点调试能够根据请求的接口到达断点地方,按步查询代码的执行。然而在 php 对接口的调试就不是那么舒服了,目前的框架内部只实现了错误日志打印,不好更准确的定位问题的所在,于是就开始了前后端分离情况下 php 调试代码探寻。
chrome安装 xdebug helper
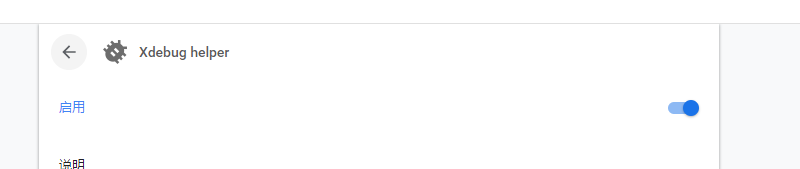
然后在选项中奖 IDE key 设置为 phpstorm phpstudy
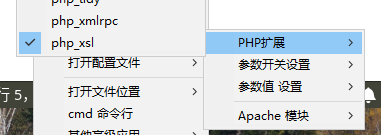
先在 phpstudy 中: 配置文件->php 扩展与设置中->php 扩展->Xdebug 打开
打开 php.ini
[XDebug] xdebug.profiler_output_dir="D:\phpStudy\PHPTutorial\tmp\xdebug" xdebug.trace_output_dir="D:\phpStudy\PHPTutorial\tmp\xdebug" xdebug.remote_log="D:\phpStudy\PHPTutorial\tmp\xdebug.log" zend_extension="D:\phpStudy\PHPTutorial\php\php-7.0.12-nts\ext\php_xdebug.dll" xdebug.remote_enable =1 xdebug.remote_handler = "dbgp" xdebug.idekey = PHPSTORM xdebug.remote_host = "127.0.0.1" xdebug.remote_port = 9000该开启的开启,该添加的添加,注意路径正确,根据个人路径更改
重启服务器,查看 phpinfo()中是否有 xdebug
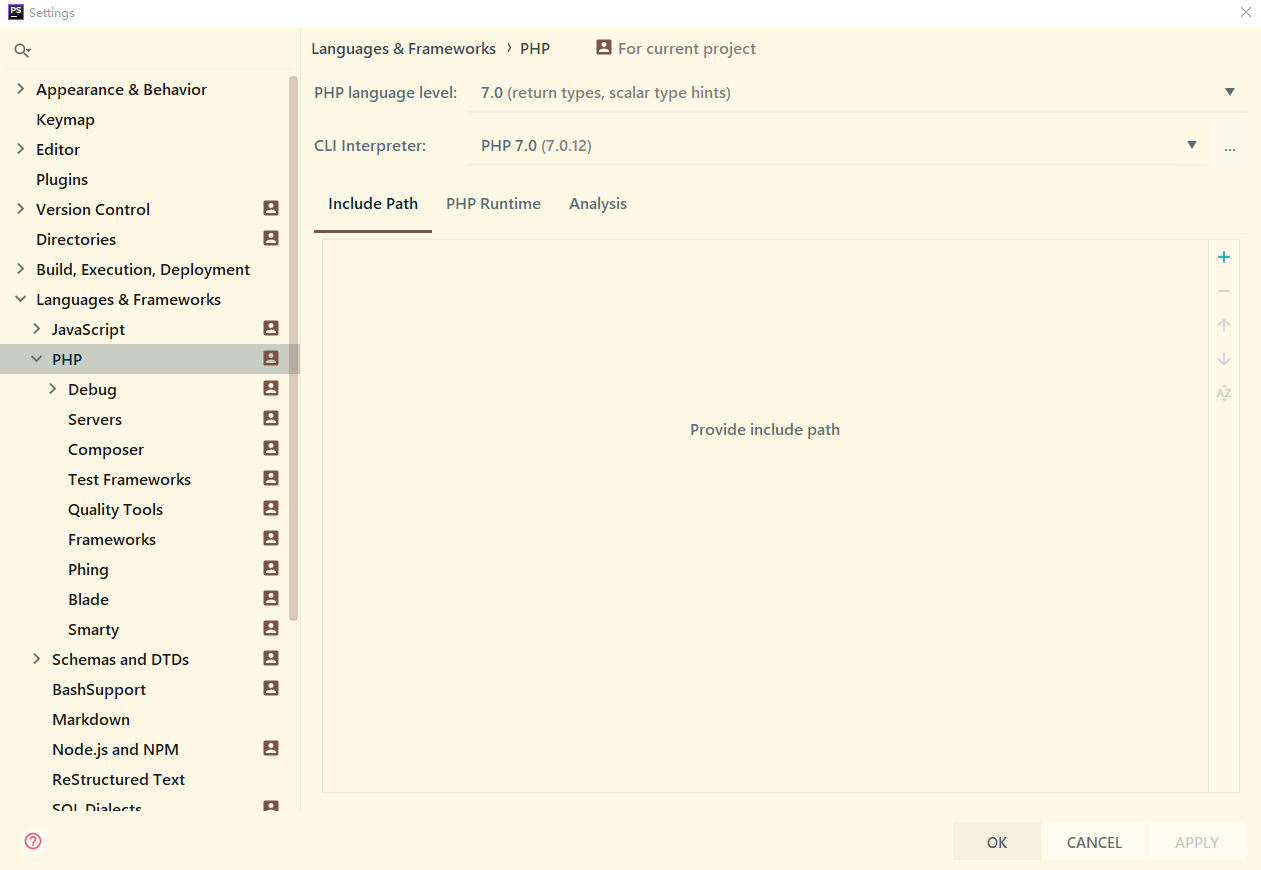
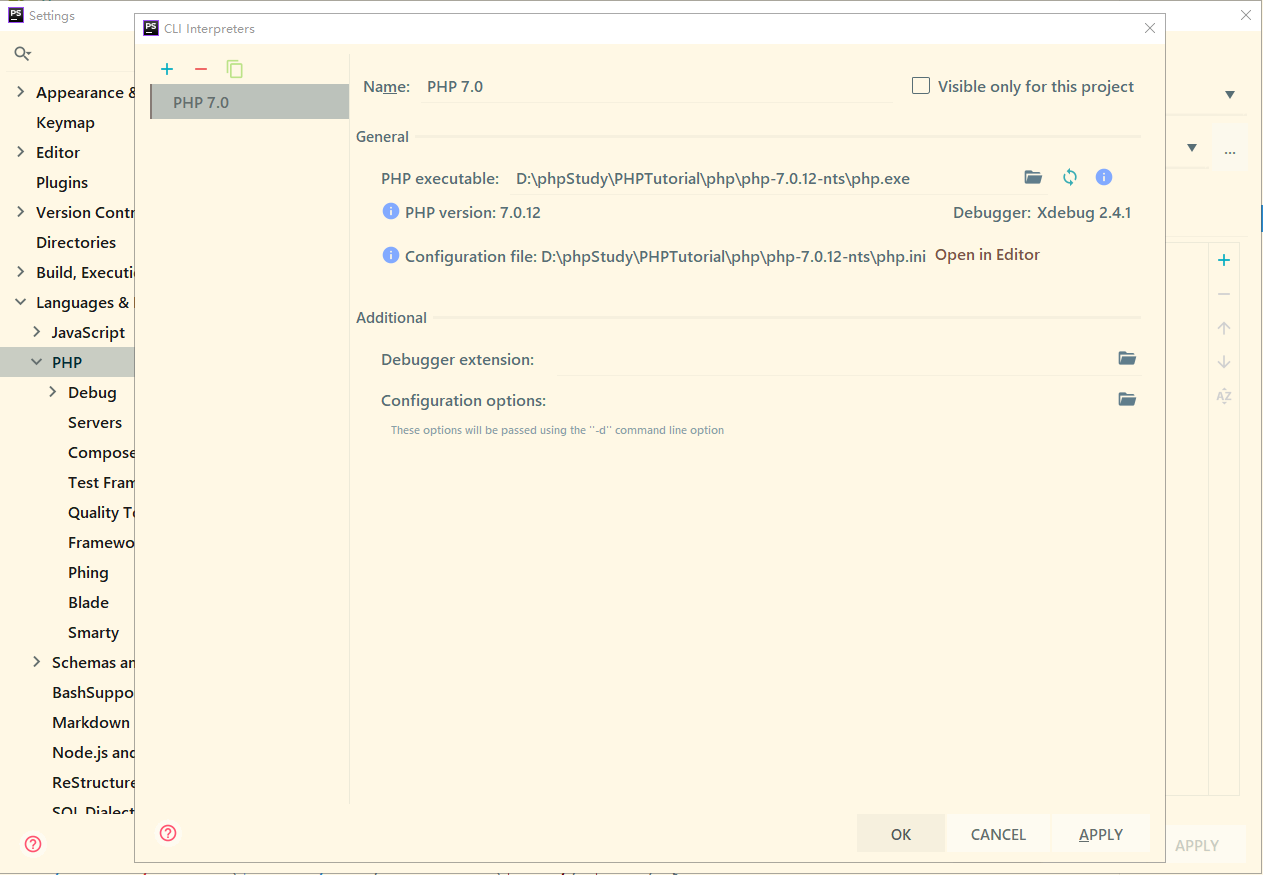
phpstorm在 setting->Languages and Frameworks->PHP
这是已经添加好的,没有配置过需要讲 php.exe 路径添加一下
PHP->debug
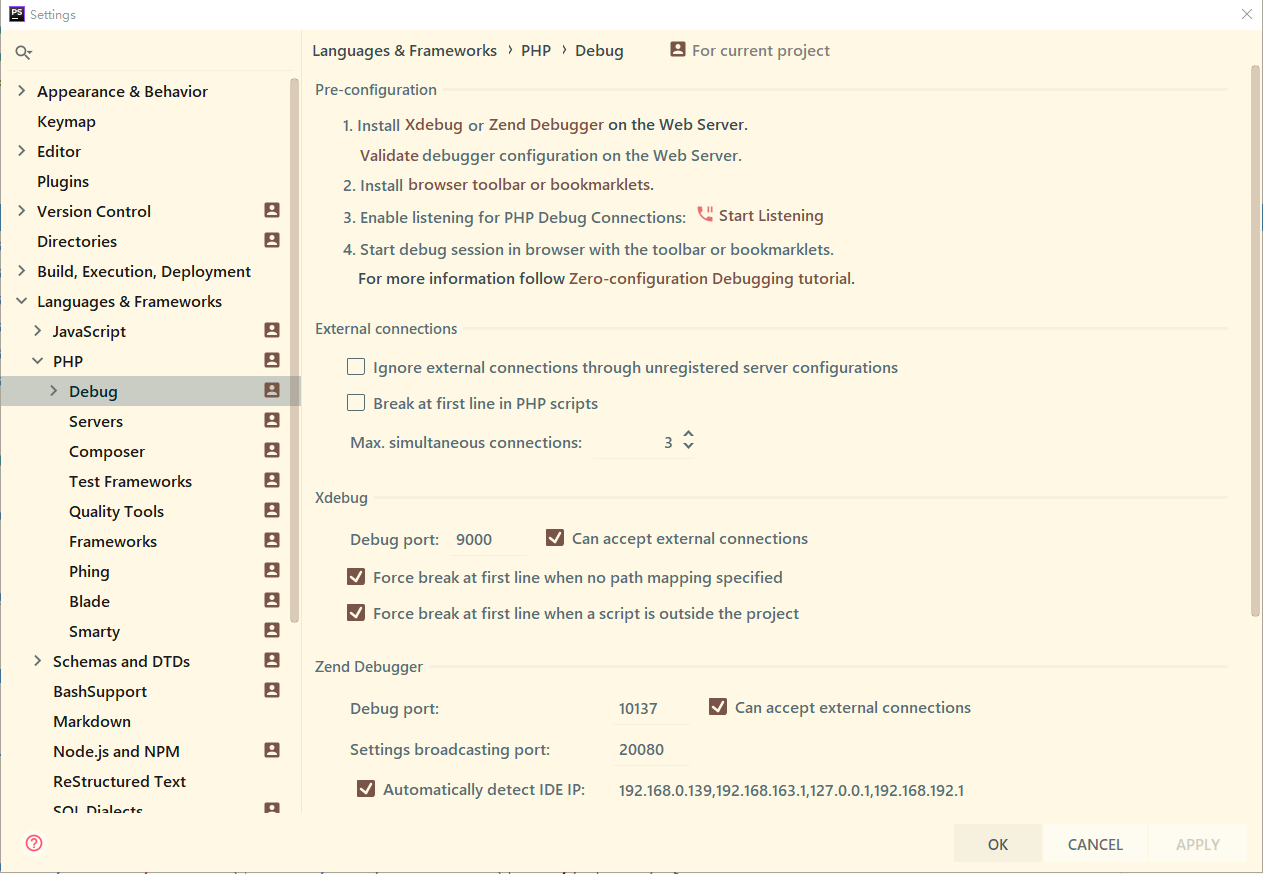
这里 debug port 设置为 php.ini 里面设置的那个端口
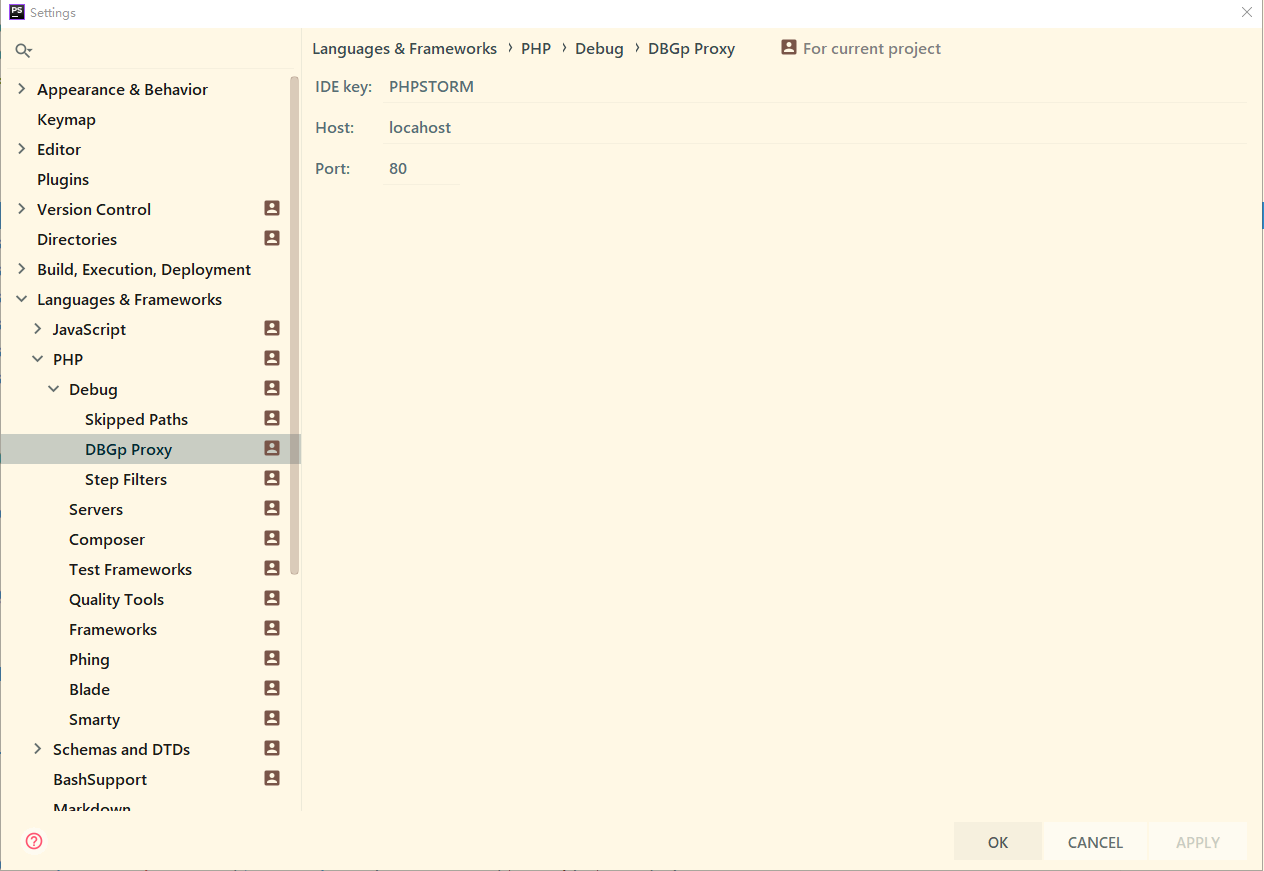
PHP->debug->DBGp proxy
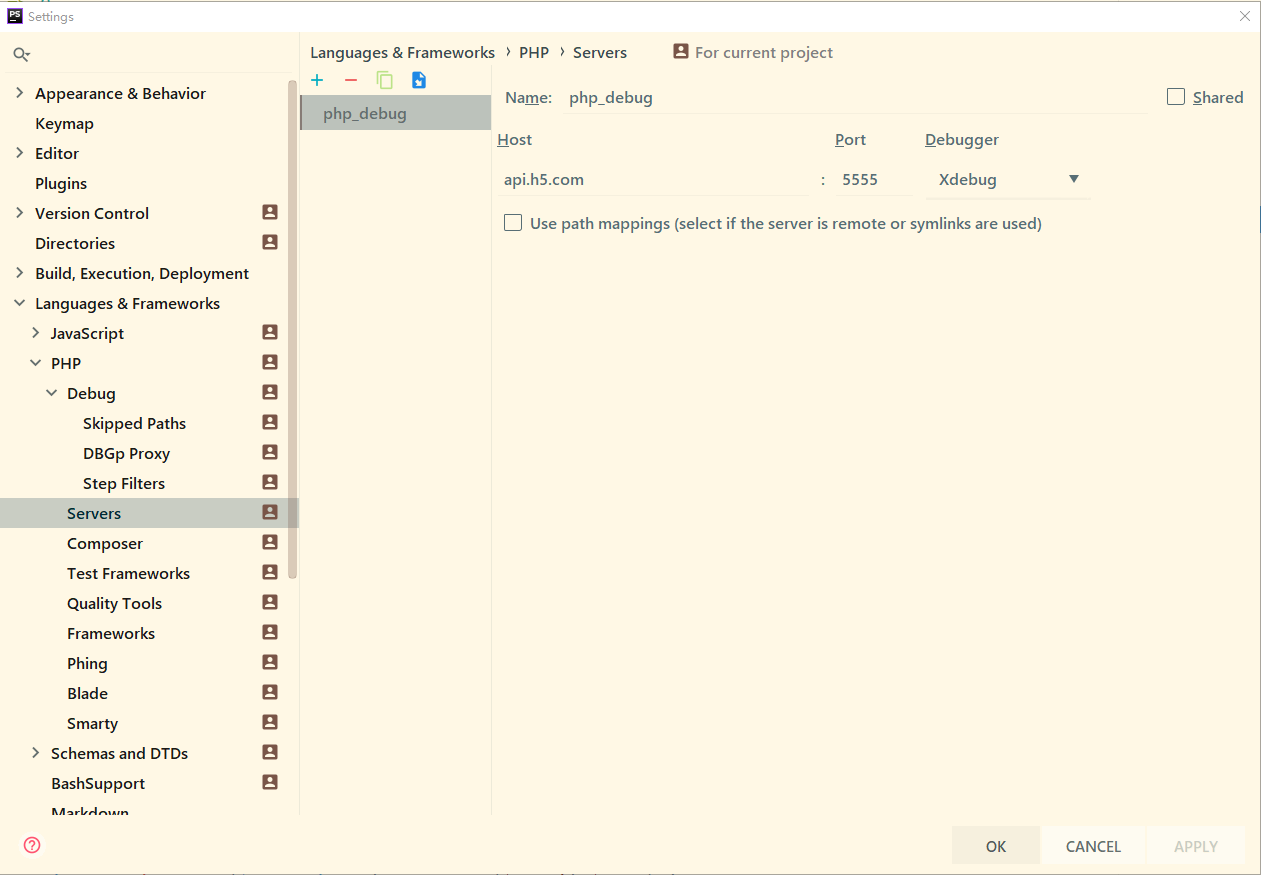
PHP->Servers
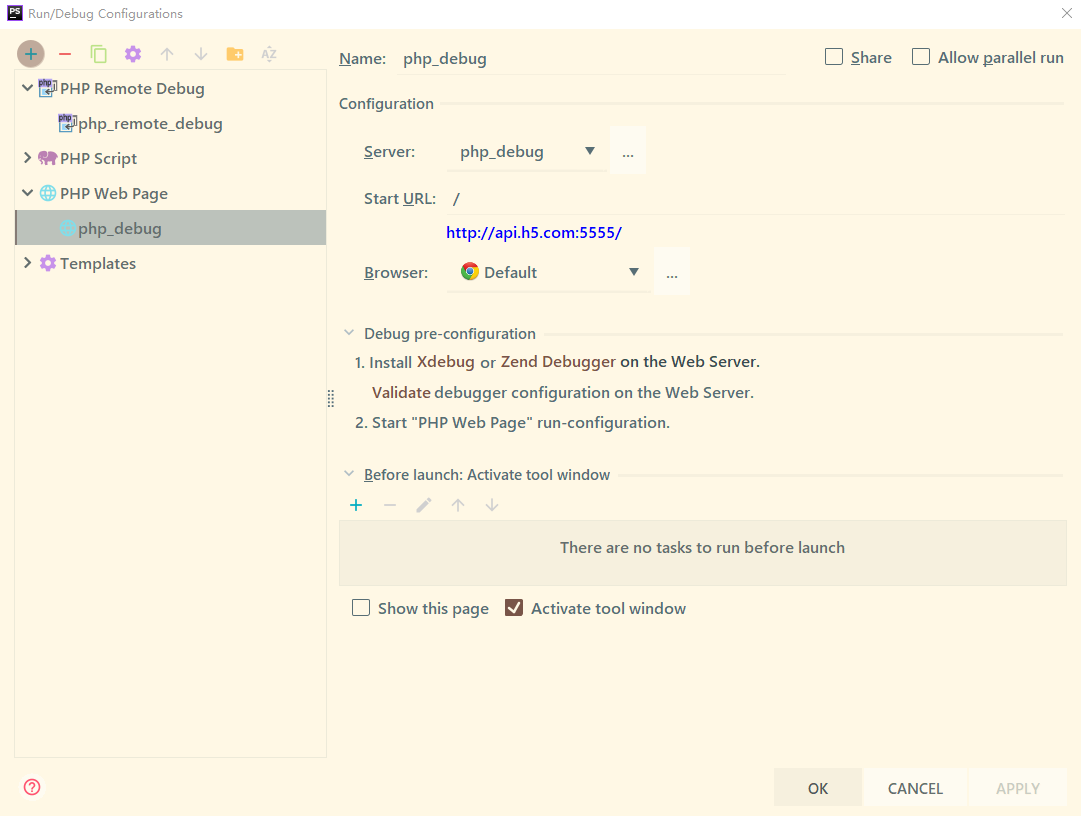
头部导航->Run->Edit Configurations
按照预设模板
在目录下的 index.php 打个断点
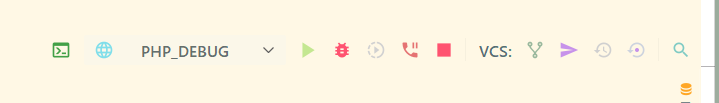
点击甲虫开启调试,点击电话开启监听
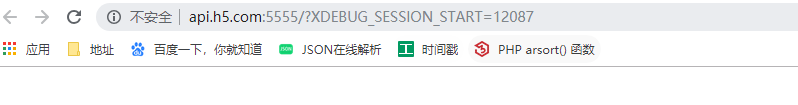
这时候你的默认浏览器会自动打开一个 tab
然后打开 phpstorm 可以看到断点已经生效了
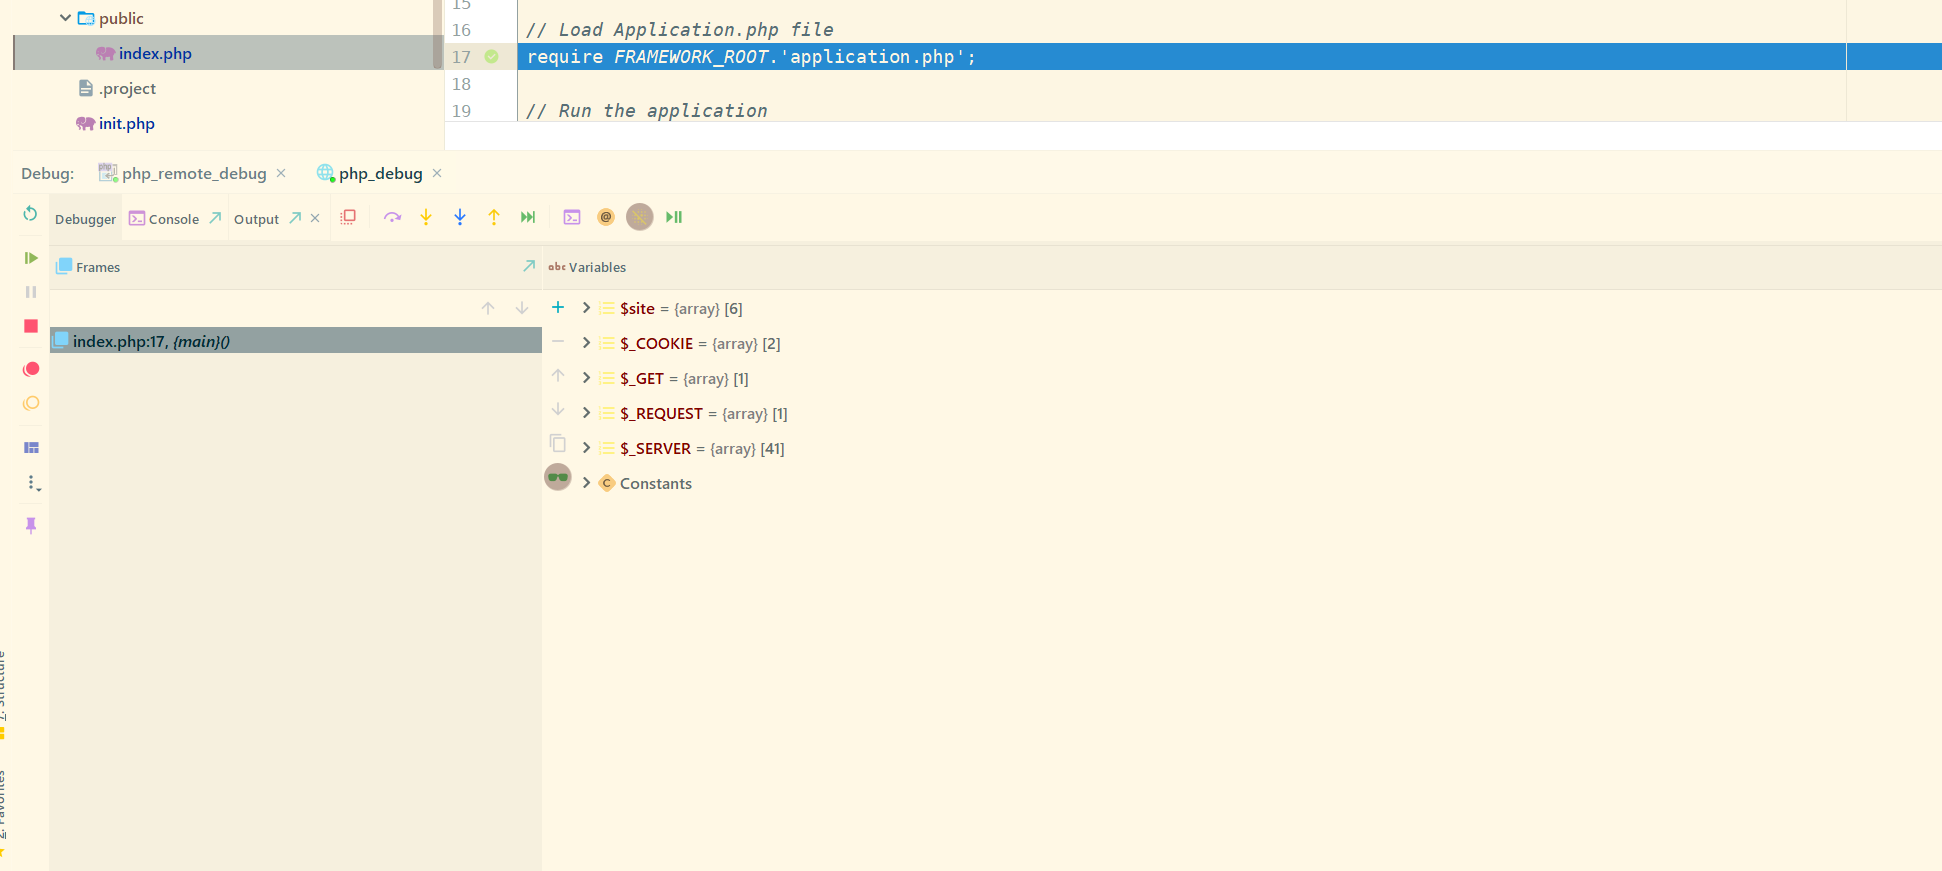
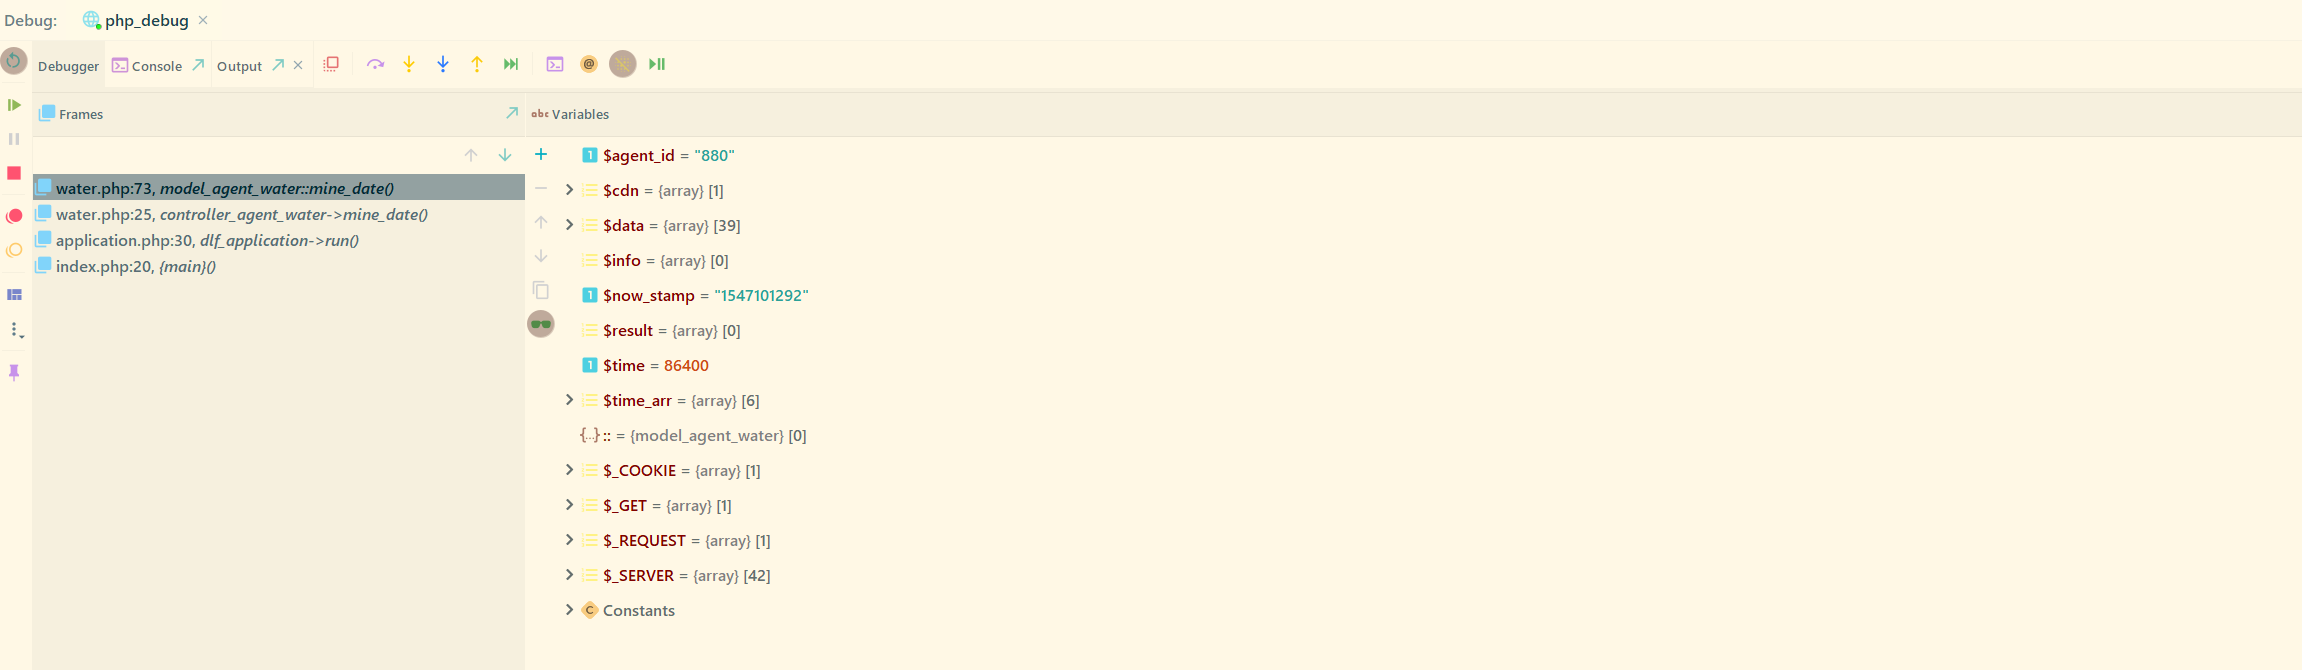
断点
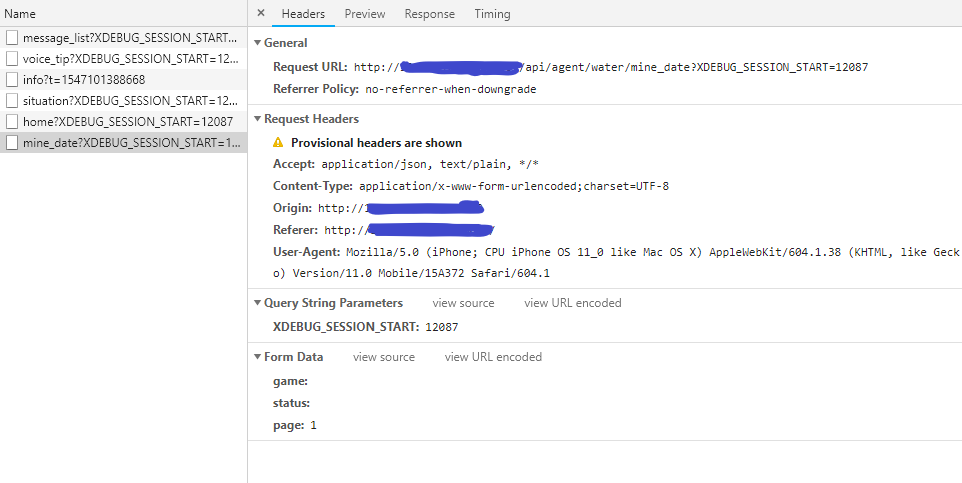
在 model 下的 mine_date 中打一个断点

请求地址
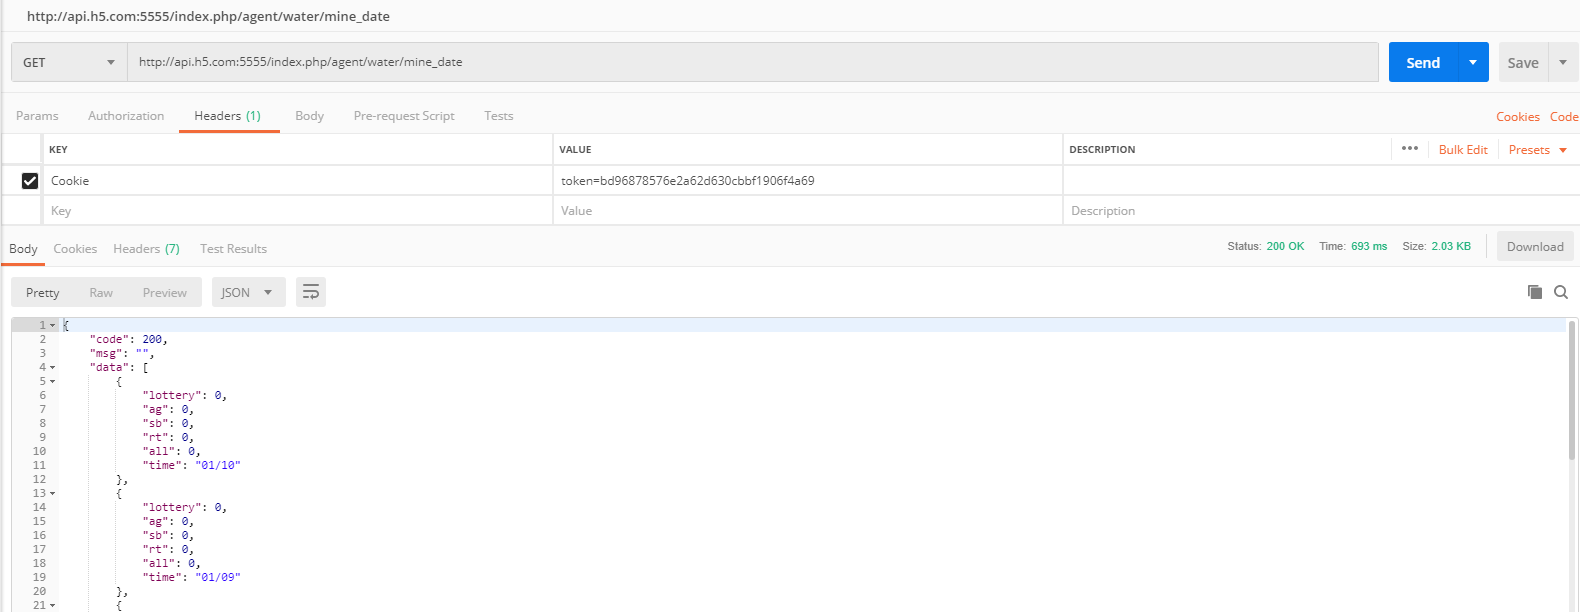
可以看到能够访问,能够获取数据,但是并没有走 debug,断点不生效
在开启调试的时候,会在默认浏览器打开一个 tab,这个网址:5555/?XDEBUG_SESSION_START=12087,可以进入调试,那将?XDEBUG_SESSION_START=12087放到postman请求的网址后面就好了
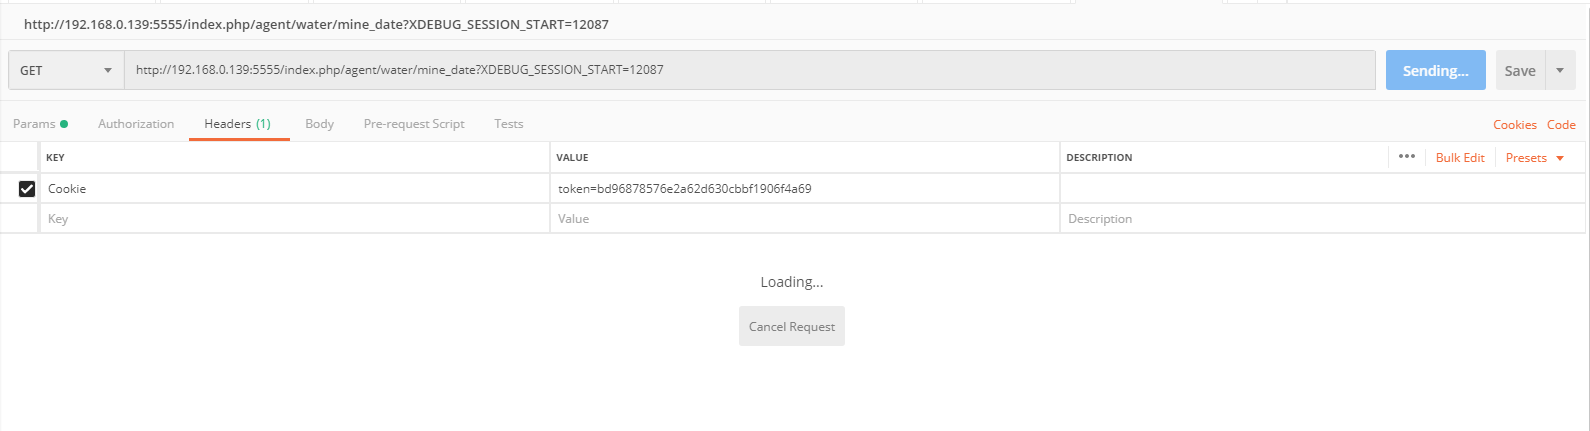
进入 loading 了,非常好
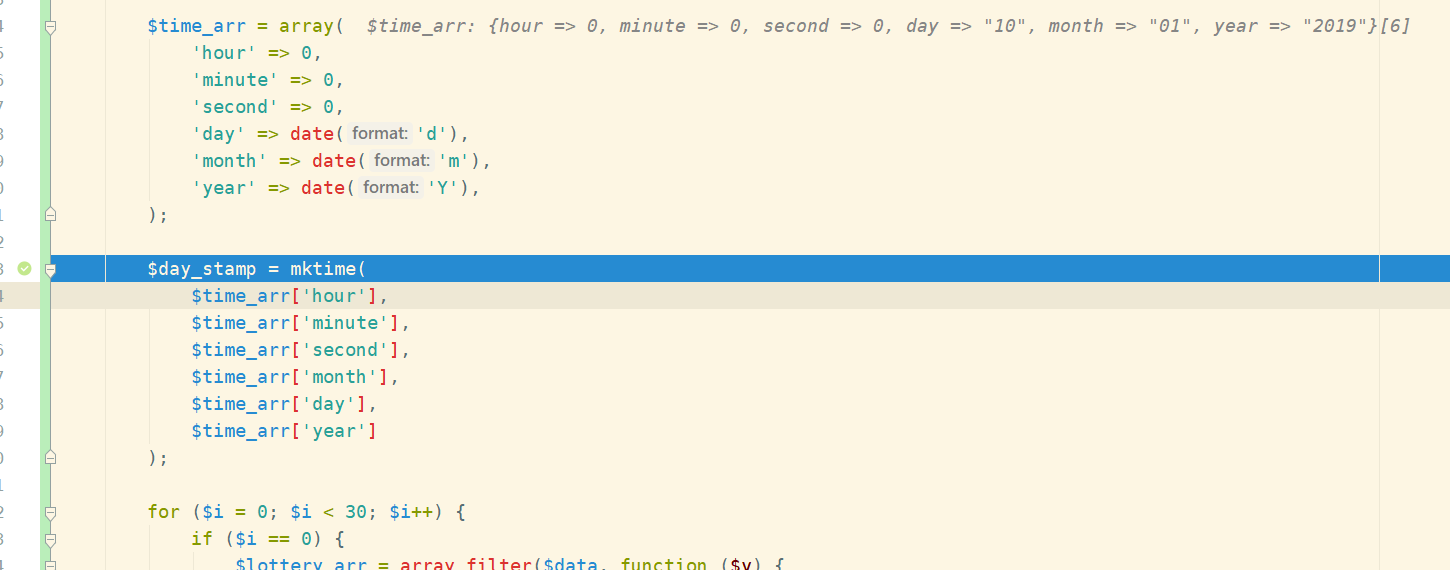
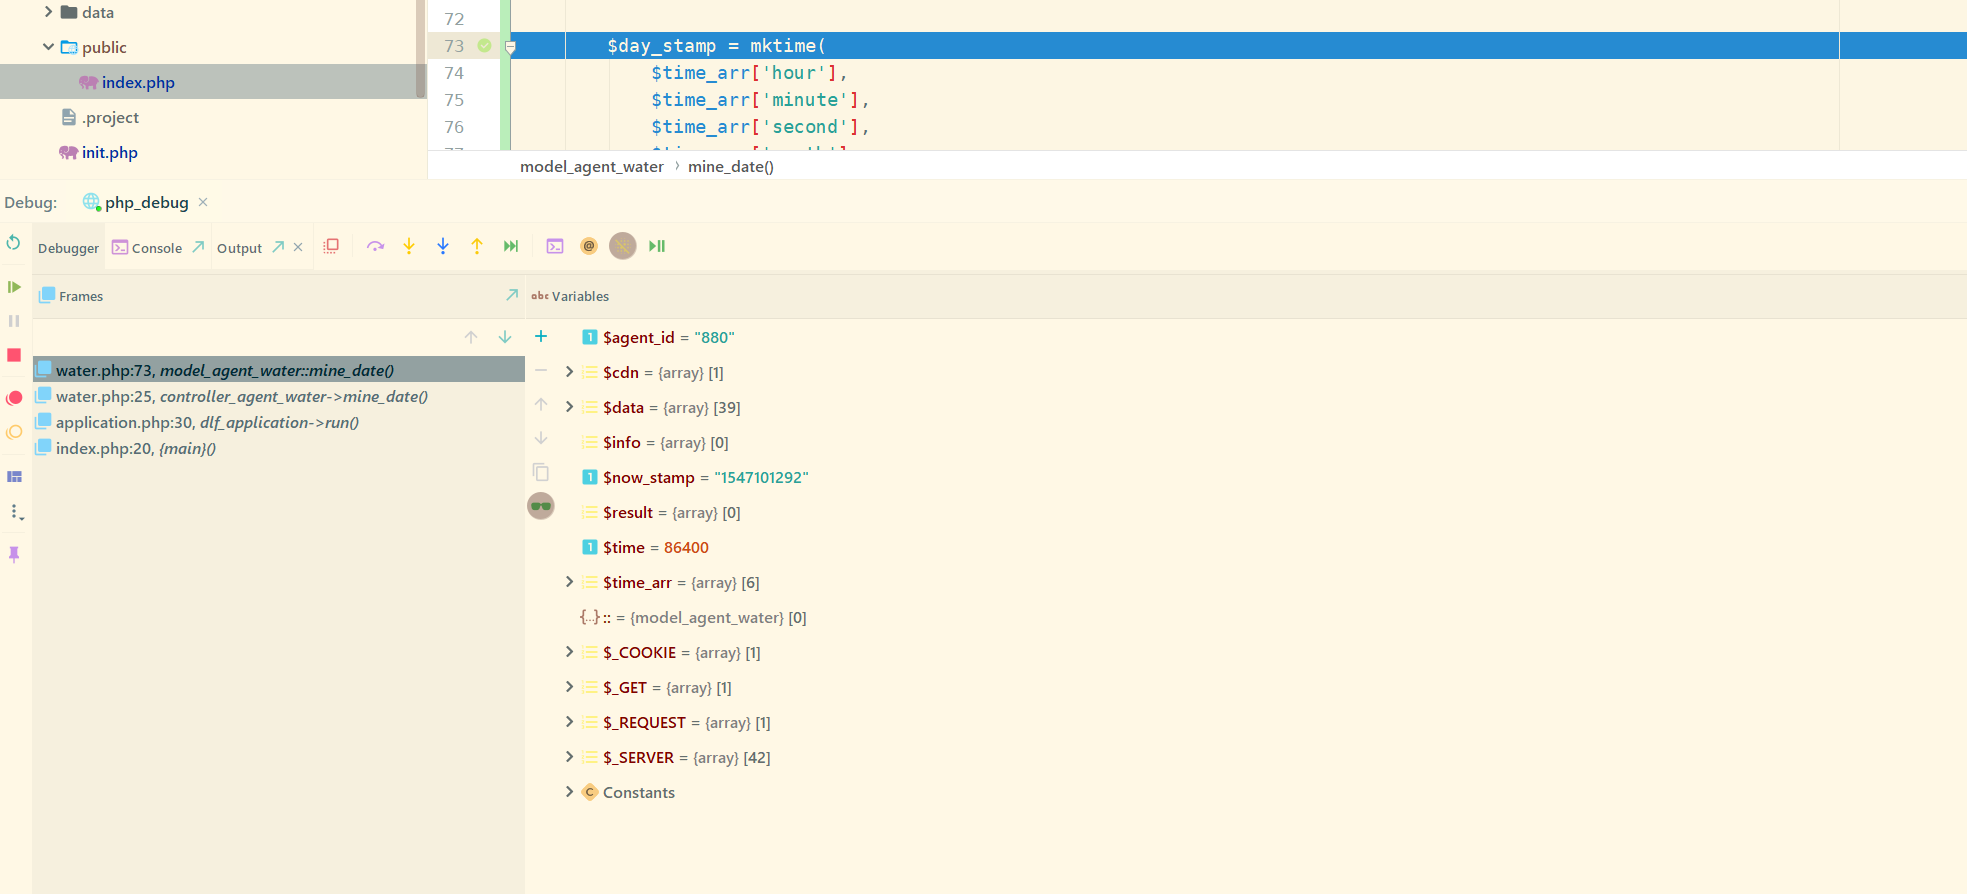
可以看到,进入到 model 里面的 mine_date 这个方法里面了,断点生效了 web
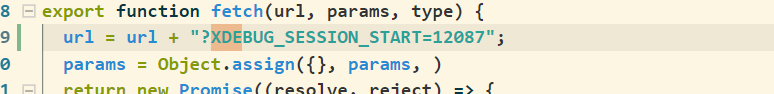
跟 postman 差不多,进行 http 请求的时候将?XDEBUG_SESSION_START=12087 添加到 url 后面就好了
然后 ajax 请求接口
php 进入调试