7.不同函数设置创建复选框库选择性显示
x = np.linspace(0, 4 * np.pi, 100) # 画布 p = figure() # 折线属性 props = dict(line_width=4, line_alpha=0.7) # 绘图3条函数序列 l0 = p.line(x, np.sin(x), color=Viridis3[0], legend="Line 0", **props) l1 = p.line(x, 4 * np.cos(x), color=Viridis3[1], legend="Line 1", **props) l2 = p.line(x, np.tan(x), color=Viridis3[2], legend="Line 2", **props) # 复选框激活显示,复选框(checkbox),三个函数序列可选择性展示出来 checkbox = CheckboxGroup(labels=["Line 0", "Line 1", "Line 2"], active=[0, 1, 2], width=100) # checkbox.callback = CustomJS(args=dict(l0=l0, l1=l1, l2=l2, checkbox=checkbox), code=""" l0.visible = 0 in checkbox.active; l1.visible = 1 in checkbox.active; l2.visible = 2 in checkbox.active; """) # 添加图层 layout = row(checkbox, p) output_notebook() # 显示 show(layout)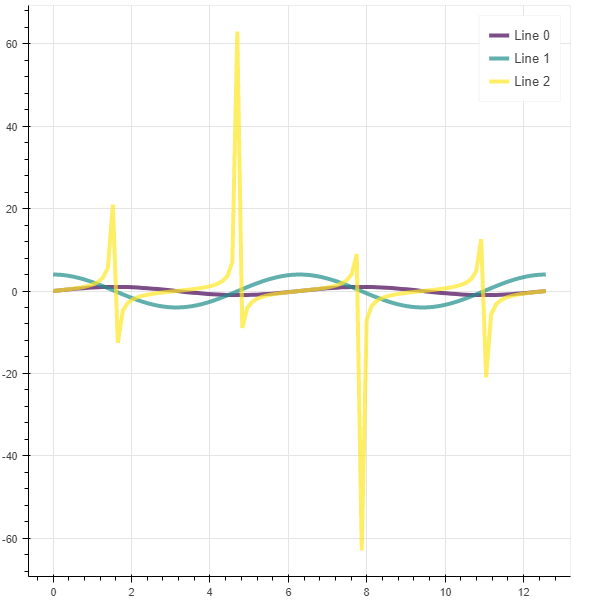
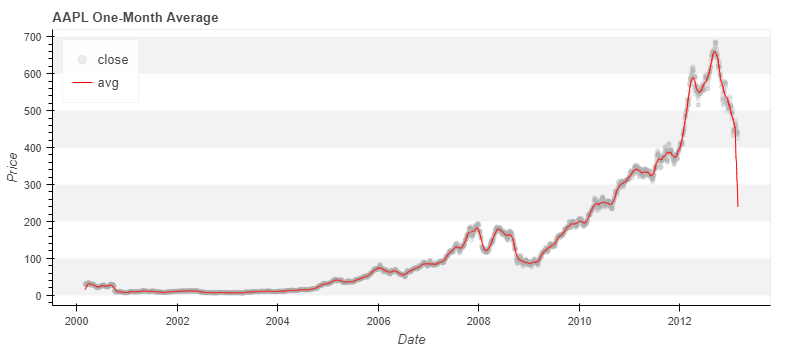
8.收盘价的时序图走势和散点图
import numpy as np from bokeh.plotting import figure from bokeh.io import show, output_notebook from bokeh.layouts import row #row()的作用是将多个图像以行的方式放到同一张图中 from bokeh.palettes import Viridis3 from bokeh.models import CheckboxGroup, CustomJS #CheckboxGroup 创建复选框库 # 数据 aapl = np.array(AAPL['adj_close']) aapl_dates = np.array(AAPL['date'], dtype=np.datetime64) window_size = 30 window = np.ones(window_size)/float(window_size) aapl_avg = np.convolve(aapl, window, 'same') # 画布 p = figure(width=800, height=350, x_axis_type="datetime") # 图层 p.circle(aapl_dates, aapl, size=4, color='darkgrey', alpha=0.2, legend='close') #散点图 p.line(aapl_dates, aapl_avg, color='red', legend='avg') #折线时序图 # 自定义视觉属性 p.title.text = "AAPL One-Month Average" p.legend.location = "top_left" p.grid.grid_line_alpha=0 p.xaxis.axis_label = 'Date' p.yaxis.axis_label = 'Price' p.ygrid.band_fill_color="gray" p.ygrid.band_fill_alpha = 0.1 p.legend.click_policy="hide" # 点击图例显示隐藏数据 # 显示结果 output_notebook() show(p)