
logstash配置文件:
[root@Elk_Server logstash]# vim /etc/logstash/conf.d/logstash.conf input { beats { host => '0.0.0.0' port => "5044" } } filter { grok { match => { "message" => ["%{TIMESTAMP_ISO8601:date}\s+(?:%{LOGLEVEL:loglevel}|%{LOGLEVEL:loglevel}\s+\d) \-+ \[%{NOTSPACE:servicename}\] %{JAVALOGMESSAGE:message}", "%{TIMESTAMP_ISO8601:date}\s+(?:%{LOGLEVEL:loglevel}|%{LOGLEVEL:loglevel}\s+\d) \-+ \[%{NOTSPACE:servicename}\{%{DATA:description}\}-%{DATA:db}\] %{JAVALOGMESSAGE:message}"] } overwrite => [ "message" ] } #geoip { # source => "remote_addr" # target => "geoip" # database => "/opt/GeoLite2-City.mmdb" # add_field => ["[geoip][coordinates]", "%{[geoip][longitude]}"] # add_field => ["[geoip][coordinates]", "%{[geoip][latitude]}"] #} date { locale => "en" match => ["date", "dd/MMM/yyyy:HH:mm:ss Z"] } } output { elasticsearch { hosts => [ "192.168.6.108:9200" ] index => "logstash-%{type}-%{+YYYY.MM.dd}" } # stdout {codec => rubydebug} } 四、安装Kibana4.1 安装Kibana
tar zxvf kibana-6.3.2-linux-x86_64.tar.gz -C /usr/local/ mv /usr/local/kibana-6.3.2-linux-x86_64 /usr/local/kibana4.2 配置Kibana
cd /usr/local/kibana/ vim config/kibana.yml #把以下注释放开,使配置起作用。 ----- server.port: 5601 server.host: "192.168.6.108" elasticsearch.url: "http://192.168.6.108:9200" kibana.index: ".kibana"4.3 启动Kibana并进行测试访问,从日志中可以看出,当前开了5601端口
./bin/kibana #后台启动 nohup /usr/local/kibana/bin/kibana & ----- log [03:30:39.833] [info][status][plugin:kibana@6.2.4] Status changed from uninitialized to green - Ready log [03:30:39.882] [info][status][plugin:elasticsearch@6.2.4] Status changed from uninitialized to yellow - Waiting for Elasticsearch log [03:30:40.026] [info][status][plugin:timelion@6.2.4] Status changed from uninitialized to green - Ready log [03:30:40.033] [info][status][plugin:console@6.2.4] Status changed from uninitialized to green - Ready log [03:30:40.037] [info][status][plugin:metrics@6.2.4] Status changed from uninitialized to green - Ready log [03:30:40.061] [info][listening] Server running at :5601 log [03:30:40.117] [info][status][plugin:elasticsearch@6.2.4] Status changed from yellow to green - Ready4.4 查看启动没有报错,可以通过192.168.6.108:5601在浏览器进行访问了。
添加索引①点击Discover出现以下界面,在logstash日志分析文件里面有建立了一个索引,索引的名称是test_log-${日期}这样的形式,它是 Elasticsearch 中的一个索引名称开头。Kibana 会自动检测在 Elasticsearch 中是否存在该索引名称。
②按照注释配置,然后点击Next step,在第二页 选择@timestamp点击create创建

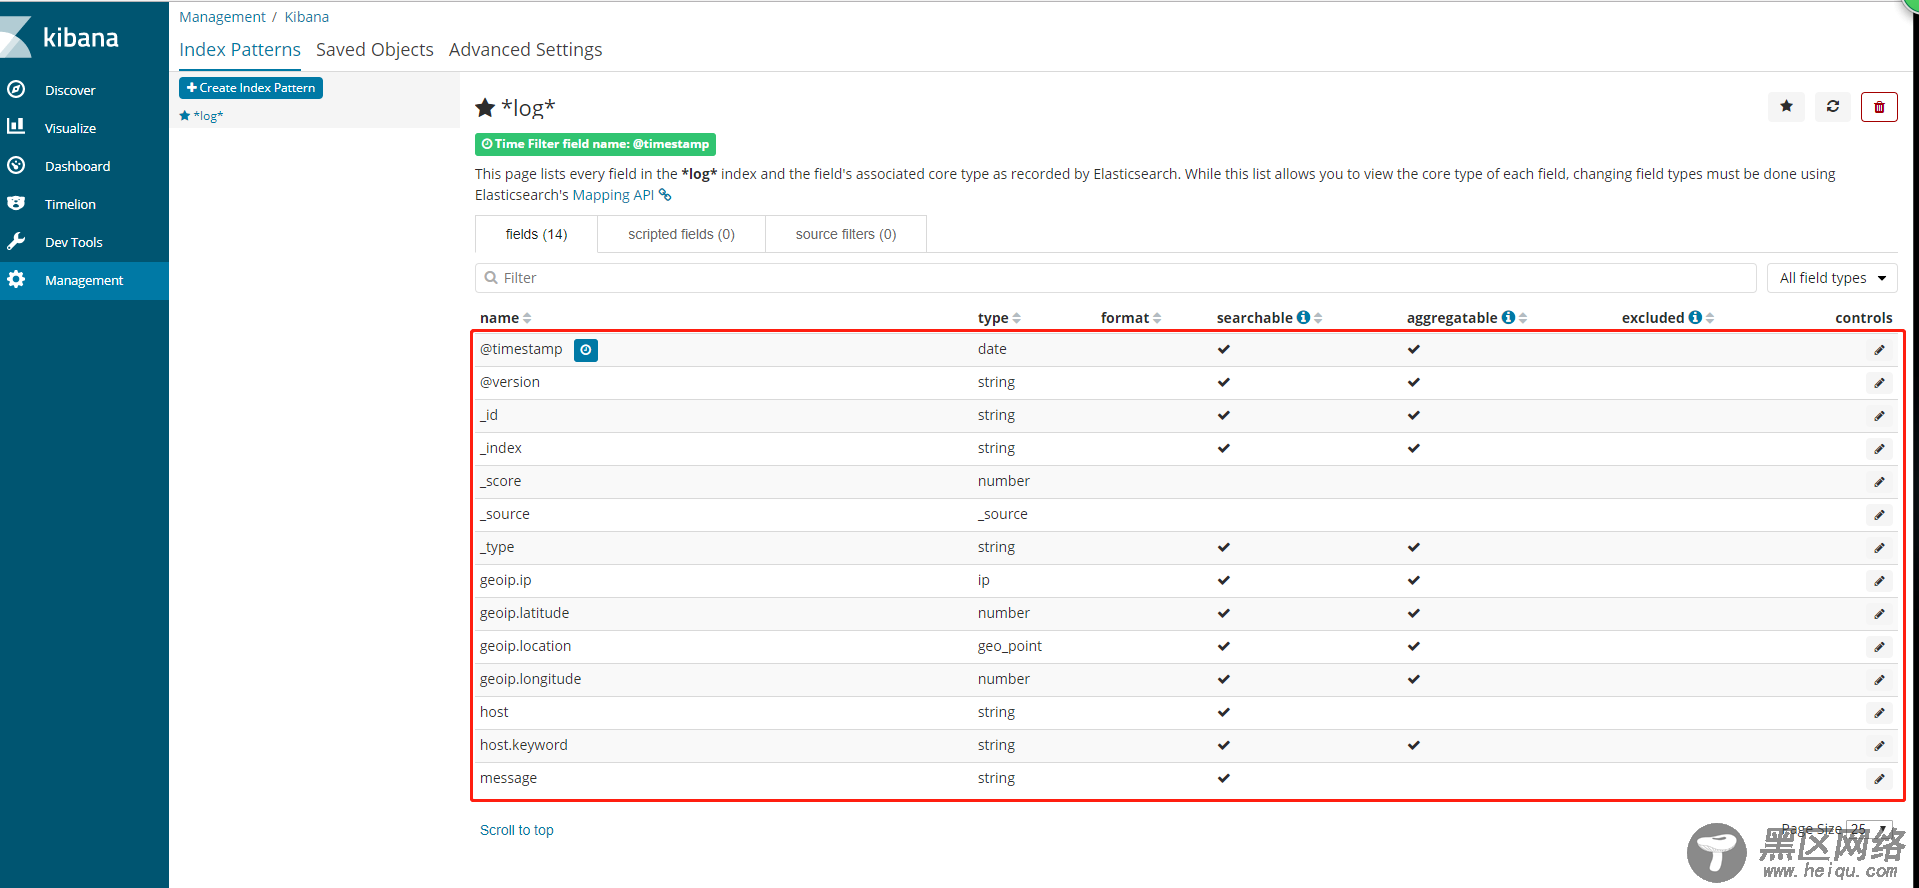
③创建完成之后,可以看到以下一个界面,红框内是 自动生成的域,也可以理解为 跟数据库中的字段类似,其中有一个message字段,就是我们想要的日志信息。
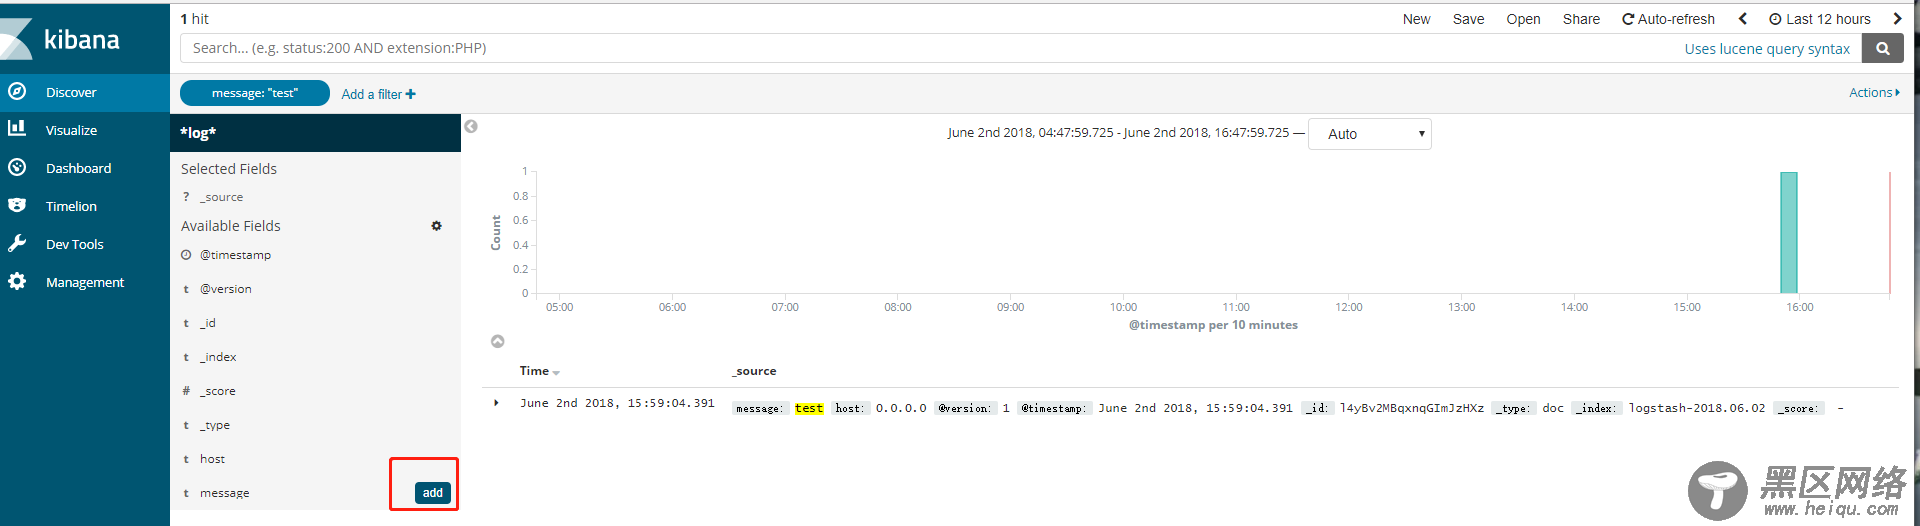
④再次点击Discover出现以下界面,可以看到默认搜索的是最后15分钟的日志,可以通过点击设置搜索的时间范围.

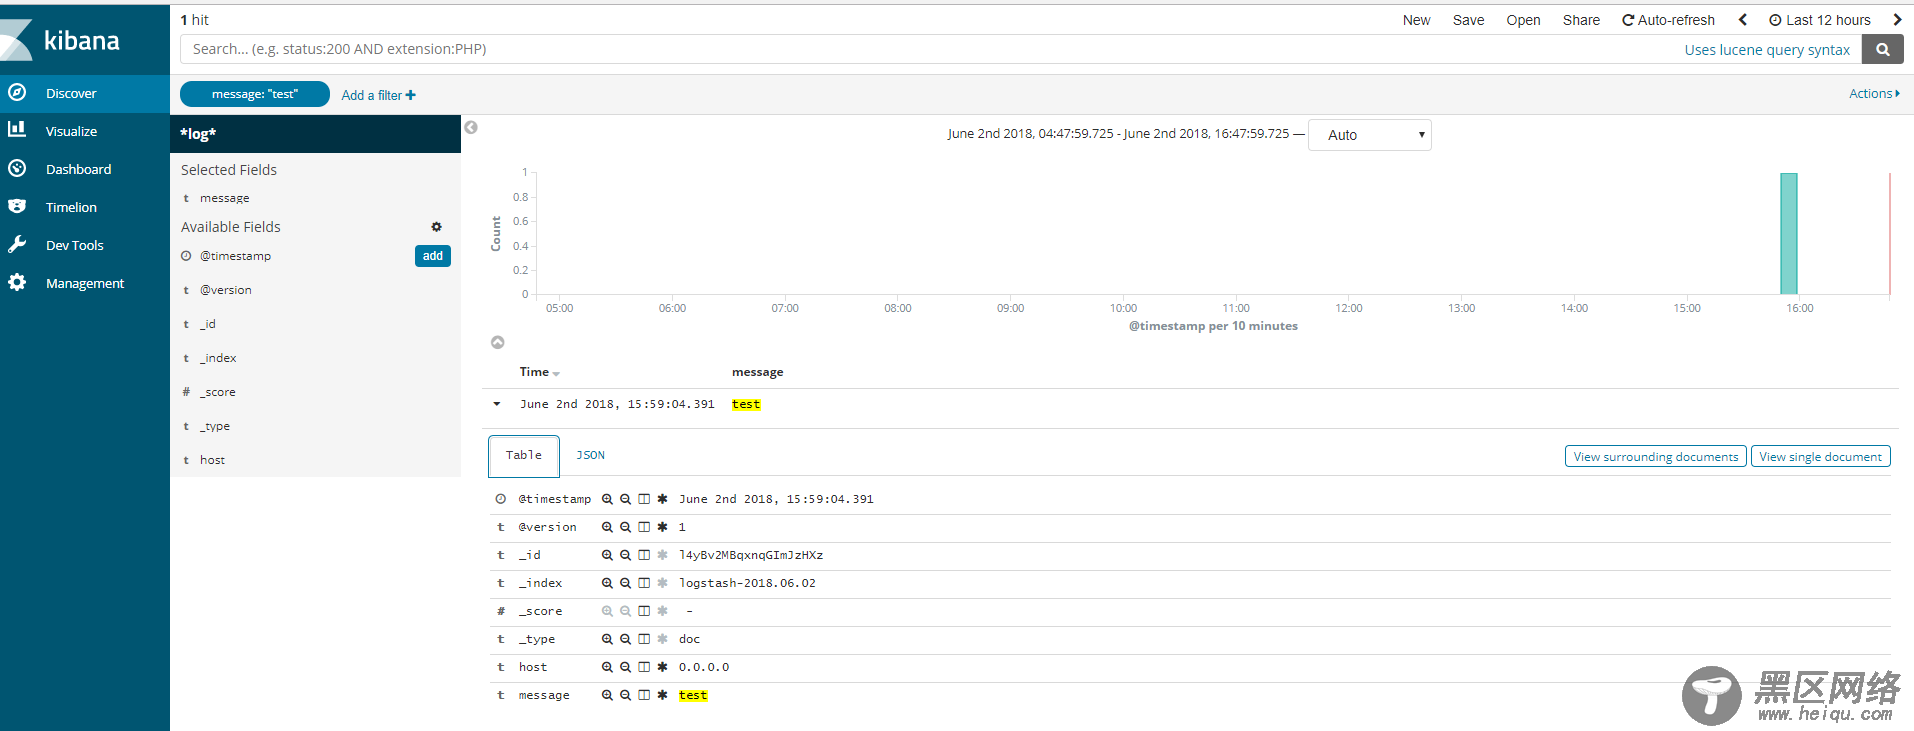
⑤可以点击右侧域的add设置需要显示的字段
添加完成之后,日志显示如下:
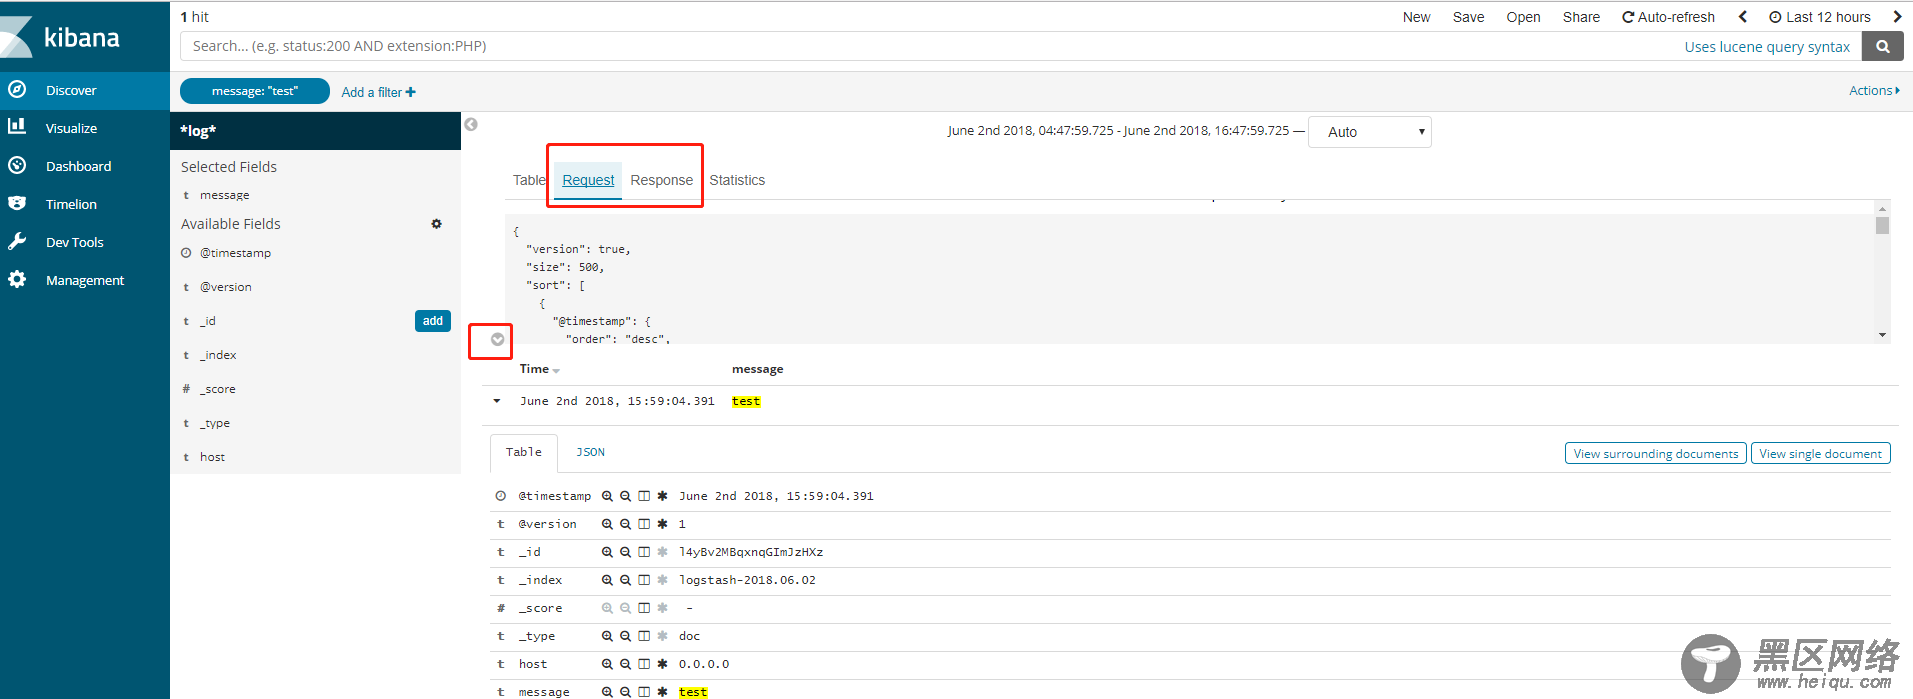
⑥也可以查看请求体和响应体
Linux公社的RSS地址:https://www.linuxidc.com/rssFeed.aspx