
2.4 安装head插件
head插件能够生成集群的统计数据,并提供浏览器查询,同时还能对elasticsearch索引进行结构化查询。
2.5 系统参数调整
##修改es三个节点的JVM运行内存,这个可以根据需要更改,但是-Xms和-Xmx的值必须一样,不然启动报错 [root@Elk_Server ]# vim /usr/local/es-master/config/jvm.options [root@Elk_Server ]# vim /usr/local/es-data1/config/jvm.options [root@Elk_Server ]# vim /usr/local/es-data2/config/jvm.options ------------------------------------------------------------------------- -Xms2g -Xmx2g ##修改Linux最大打开文件数 vim /etc/security/limits.conf * soft nofile 655350 ##在末尾添加 * hard nofile 655350 ##这一步需要重启linux使配置生效 reboot [root@Elk_Server~]# ulimit -n 655350 ##修改sysctl.conf文件 [root@Elk_Server ~]# vim /etc/sysctl.conf vm.max_map_count=655350 [root@Elk_Server ~]# sysctl -p2.6 将ES的head插件启动
cd /usr/local/es-master/head/elasticsearch-head && grunt server & [3] 5946 ##会开启9100端口。2.7 启动Elasticsearch(ES只能使用普通用户启动)
chown -R elasticsearch:elasticsearch /usr/local/es-* chown -R elasticsearch:elasticsearch /data{,1,2}/elasticsearch ##切换到普通用户启动elasticsearch su - elasticsearch nohup /usr/local/es-master/bin/elasticsearch & # -d或&以后台的方式进行启动Elasticsearch [1] 6202 ##启动成功是会开启9200,9300两个端口的。 ##传输端口为9300接受http请求的端口为9200 ##在浏览器打开可以利用head插件查看elasticsearch的集群及索引情况2.8 主节点启动好后,用同样的方法启动子节点就可以了。
如果报错,解决方式: https://www.linuxidc.com/Linux/2019-08/159734.htm
2.9 验证启动
ps axu |grep elasticsearch 方法一: curl 'http://192.168.6.108:9200/_search?pretty' ----- { "took" : 9, "timed_out" : false, "_shards" : { "total" : 0, "successful" : 0, "skipped" : 0, "failed" : 0 }, "hits" : { "total" : 0, "max_score" : 0.0, "hits" : [ ] } } 方法二: //或者通过浏览器访问::9200/ #检查es版本信息 curl -u <user>:<passwd> :9200 #此时观察ES集群状态: curl :9200/_cluster/health?pretty #观察集群内各索引状态: curl :9200/_cat/indices?pretty #查询elasticsearch节点状态: curl -XGET :9200/_cat/shards |grep UNASSIGNED #查看节点列表 :9200/_cat/nodes?v curl 'IP:9200/_cat/nodes?v' #列出所有索引及存储大小 :9200/_cat/indices?v curl 'IP:9200/_cat/indices?v'--查询所有索引及数据大小 #创建索引 创建索引名为XX,默认会有5个分片,1个索引 curl -XPUT 'IP:9200/XX?pretty' #添加一个类型 curl -XPUT 'IP:9200/XX/external/2?pretty' -d ' { "gwyy": "John" }' #更新一个类型 curl -XPOST 'IP:9200/XX/external/1/_update?pretty' -d ' { "doc": {"name": "Jaf"} }' #删除指定索引 curl -XDELETE 'IP:9200/_index?pretty' 三、安装Logstash:Logstash的功能如下:
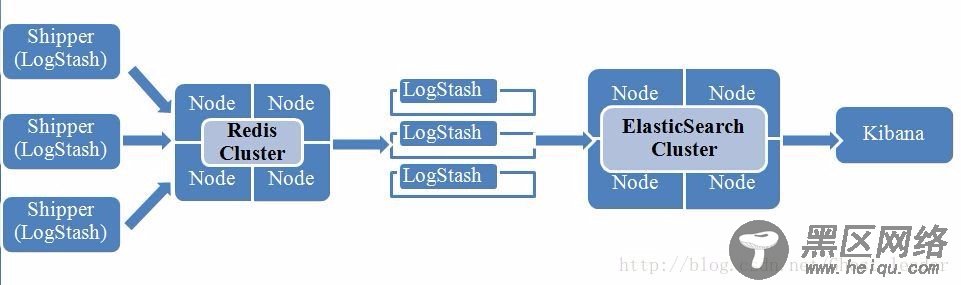
其实它就是一个收集器而已,我们需要为它指定Input和Output(当然Input和Output可以为多个)。由于我们需要把Java代码中Log4j的日志输出到ElasticSearch中,因此这里的Input就是Log4j,而Output就是ElasticSearch。
3.1 安装Logstash
tar zxvf logstash-6.3.2.tar.gz -C /usr/local/ mv /usr/local/logstash-6.3.2 /usr/local/logstash ln -s /usr/local/logstash/bin/logstash /usr/bin/ mkdir -p /data/logs/logstash3.2 验证安装是否成功,从下图中可以看到,当前开启的是9600端口
logstash -e 'input { stdin { } } output { elasticsearch { hosts => ["192.168.6.108:9200"] } stdout { codec => rubydebug }}' ###等待片刻后出现“The stdin plugin is now waiting for input:”,输入“test”回车,返回下面标准的输出。 ----- [2018-07-31T07:34:23,968][INFO ][logstash.agent ] Successfully started Logstash API endpoint {:port=>9600} test { "@version" => "1", "host" => "Elk_Server", "message" => "test", "@timestamp" => 2018-07-31T07:34:40.422Z }