
记录Python3使用Matplotlib 绘制精美的数学图形。
一个最最简单的例子:
绘制一个从 0 到 360 度完整的 SIN 函数图形
import numpy as np
import matplotlib.pyplot as pt
x = np.arange(0, 360)
# 如果打印 x ,NumPy 会给你很好看的打印格式
# print(x)
y = np.sin(x * np.pi / 180)
pt.plot(x, y)
pt.xlim(0, 360)
pt.ylim(-1.2, 1.2)
pt.title("SIN function")
pt.show()
效果图如下:

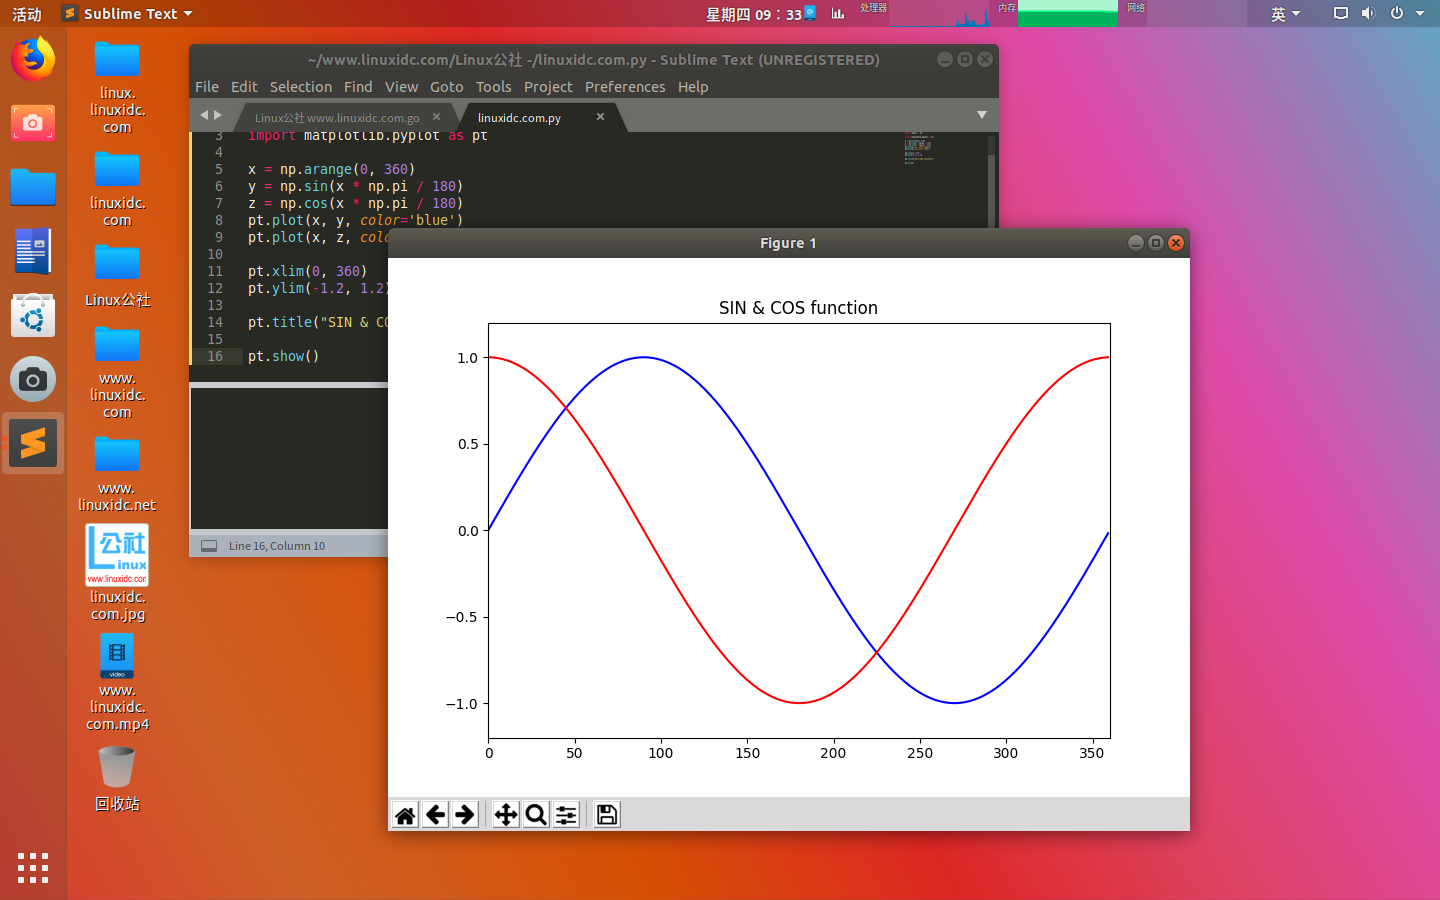
下面我们加上一个 COS 函数图形,并且使用不同的颜色来表示。
import numpy as np
import matplotlib.pyplot as pt
x = np.arange(0, 360)
y = np.sin(x * np.pi / 180)
z = np.cos(x * np.pi / 180)
pt.plot(x, y, color='blue')
pt.plot(x, z, color='red')
pt.xlim(0, 360)
pt.ylim(-1.2, 1.2)
pt.title("SIN & COS function")
pt.show()
效果图:
然后,我们加上图例,x 轴的说明和 y 轴的说明。
import numpy as np
import matplotlib.pyplot as pt
x = np.arange(0, 360)
print(x)
y = np.sin(2 * x * np.pi / 180.0)
z = np.cos(x * np.pi / 180.0)
# 使用美元符号把标签包围起来,得到 LaTex 公式显示的效果
pt.plot(x, y, color='blue', label="$SIN(2x)$")
pt.plot(x, z, color='red', label="$COS(x)$")
pt.xlim(0, 360)
pt.ylim(-1.2, 1.2)
pt.title("SIN & COS function")
# 要有 pt.legend() 这个方法才会显示图例
pt.legend()
pt.show()
效果图如下:
