
MySQL 的 Query Profiler 是一个使用非常方便的 Query 诊断分析工具,通过该工具可以获取一条Query 在整个执行过程中 多种资源的消耗情况,如 CPU,IO,IPC,SWAP 等,以及发生的 PAGE FAULTS,CONTEXT SWITCHE 等等,同时还能得到该 Query 执行过程中 MySQL 所调用的各个函数在源文件中的位置。
通过慢日志查询可以知道哪些SQL语句执行效率低下,通过explain我们可以得知SQL语句的具体执行情况,索引使用等,还可以结合show命令查看执行状态。如果觉得explain的信息不够详细,可以同通过profiling命令得到更准确的SQL执行消耗系统资源的信息。
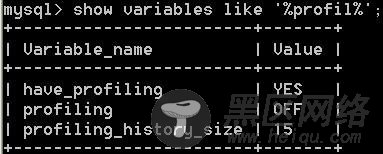
profiling默认是关闭的
1. show variables like '%profiling%';(查看profiling信息)
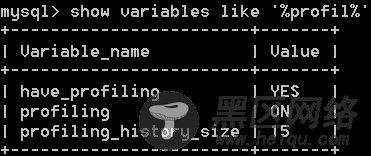
2. set profiling=1;(开启profiling)
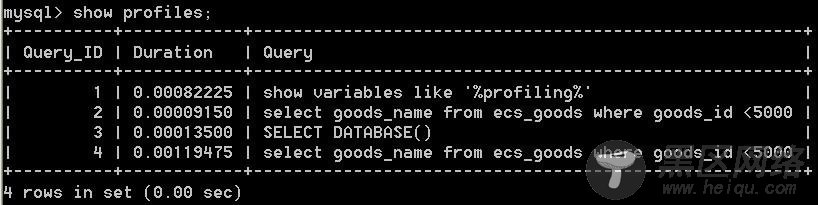
3. 执行SQL查询
例:select goods_name from ecs_goods where goods_id <5000;
show profiles;
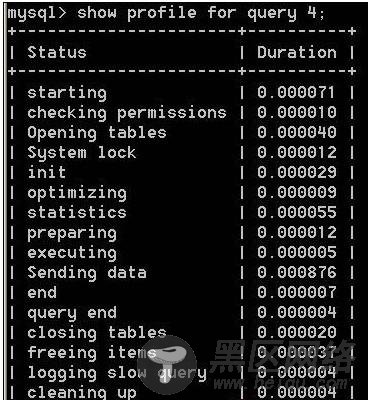
4. show profile for query 4;
show profile 的格式如下:
# The ideal of life is for ideal life! #